Just like we gradually introduce our children to the signs and sounds of language, mathematics pre-literacy is an important first step towards understanding operations and equations.
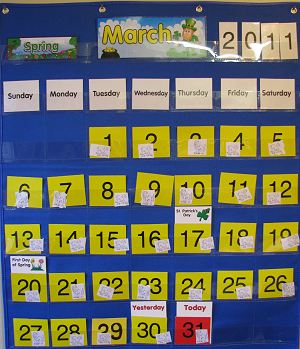
A fun way to familiarize children with the vocabulary and tools of mathematics is to make a bar graph. We’ve done this before with Valentine’s Candy Hearts and for this activity we used our March Lion and Lamb calendar cut-outs.
1. Each day in March, determine whether it is a “lamb” or “lion” day and place a lamb or lion on the calendar. We discussed each day, considering whether or not it was clear, raining, sleeting, snowing, if it was sunny, partly cloudy, or cloudy, how windy it was, and how warm it was. This is a largely subjective distinction as my children deemed any day they were not forced to wear gloves and hat to play outside a “lamb day”.
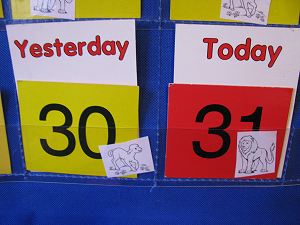
2. At the end of March, gather up all your lambs and lions.
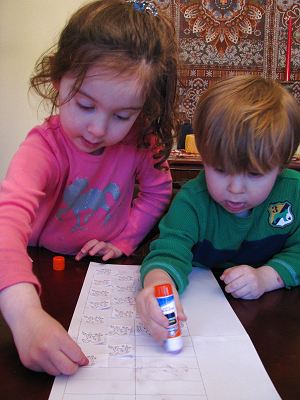
3. Print out a grid with enough rows for the lambs and lions. Paste each animal in the proper column.
4. Without counting, can you determine whether there were more lamb or lion days in March?
5. Color the lambs in yellow and the lions in blue.
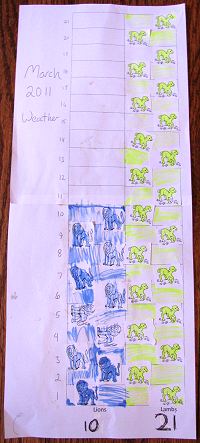 Depending on the age of the child, you can introduce terms like “bar graph” and “x axis” and “y axis”.
As you can see from our chart, the lambs won out with my kiddos this year!
Advanced Extension for Grade School Students: Record the temperature each day in March. Create a line graph.
Shared at: Link and Learn
What a fun idea!!! Stopping by from the NTFF link up!